Delivering Quality: E2E Integration Testing for Real-Time Ransomware Defense
In today's cybersecurity landscape, ransomware attacks are faster , more sophisticated - and more damaging than ever.
This raised a crucial question for our engineering team:
|🧠 How do you test a platform designed to stop ransomware in real time
🎯 Our answer: A powerful end-to-end (E2E) testing framework, built on CI/CD pipelines, Infrastructure-as-Code (IaC), and browser-based testing with Playwright.
In this post, we take you behind the scenes of how we built this E2E pipeline — and what we learned along the way.
🔧 What Challenges Were We Solving?
Testing a real-time ransomware defense platform means overcoming several complex challenges:
- 🧩 Dynamic Infrastructure: Different environments, unique configurations.
- ⚙️ Scalability: Multiple VMs, parallel test execution.
- 🛠️ Agent Installation: Automated the deployment of the ransomware-detecting .exe agent on Azure VMs.
- 🔗 CI/CD Integration: Seamless orchestration via GitHub Actions.
- 🪵 Debugging: Detailed logs, screenshots, and test results.
- 🔐 Security: Safe handling of sensitive environment data and configurations.
Our E2E Testing Framework at a Glance
To solve these challenges, We designed a robust, layered, and fully automated architecture to support E2E testing for a real-time ransomware defense platform.
🚀 1. GitHub Actions for CI/CD Orchestration
GitHub Actions orchestrates the entire workflow:
- Dynamic Inputs like ENVIRONMENT_ID, VM_OPTION, and WINDOWS_VERSION customize each test run.
- Conditional Jobs control whether to fetch VM images, install agents, or run tests — based on workflow inputs.
- Artifact Uploads include test logs, reports, and Terraform plans for easy access and analysis.
🎭 2. Playwright for Browser-Based Testing
We use Playwright to automate critical workflows such as:
- Organization creation
- Device registration
- Agent validation
Key Features:
- Headless Testing: Runs smoothly inside CI pipelines
- Browser Setup: Auto-installs required browsers
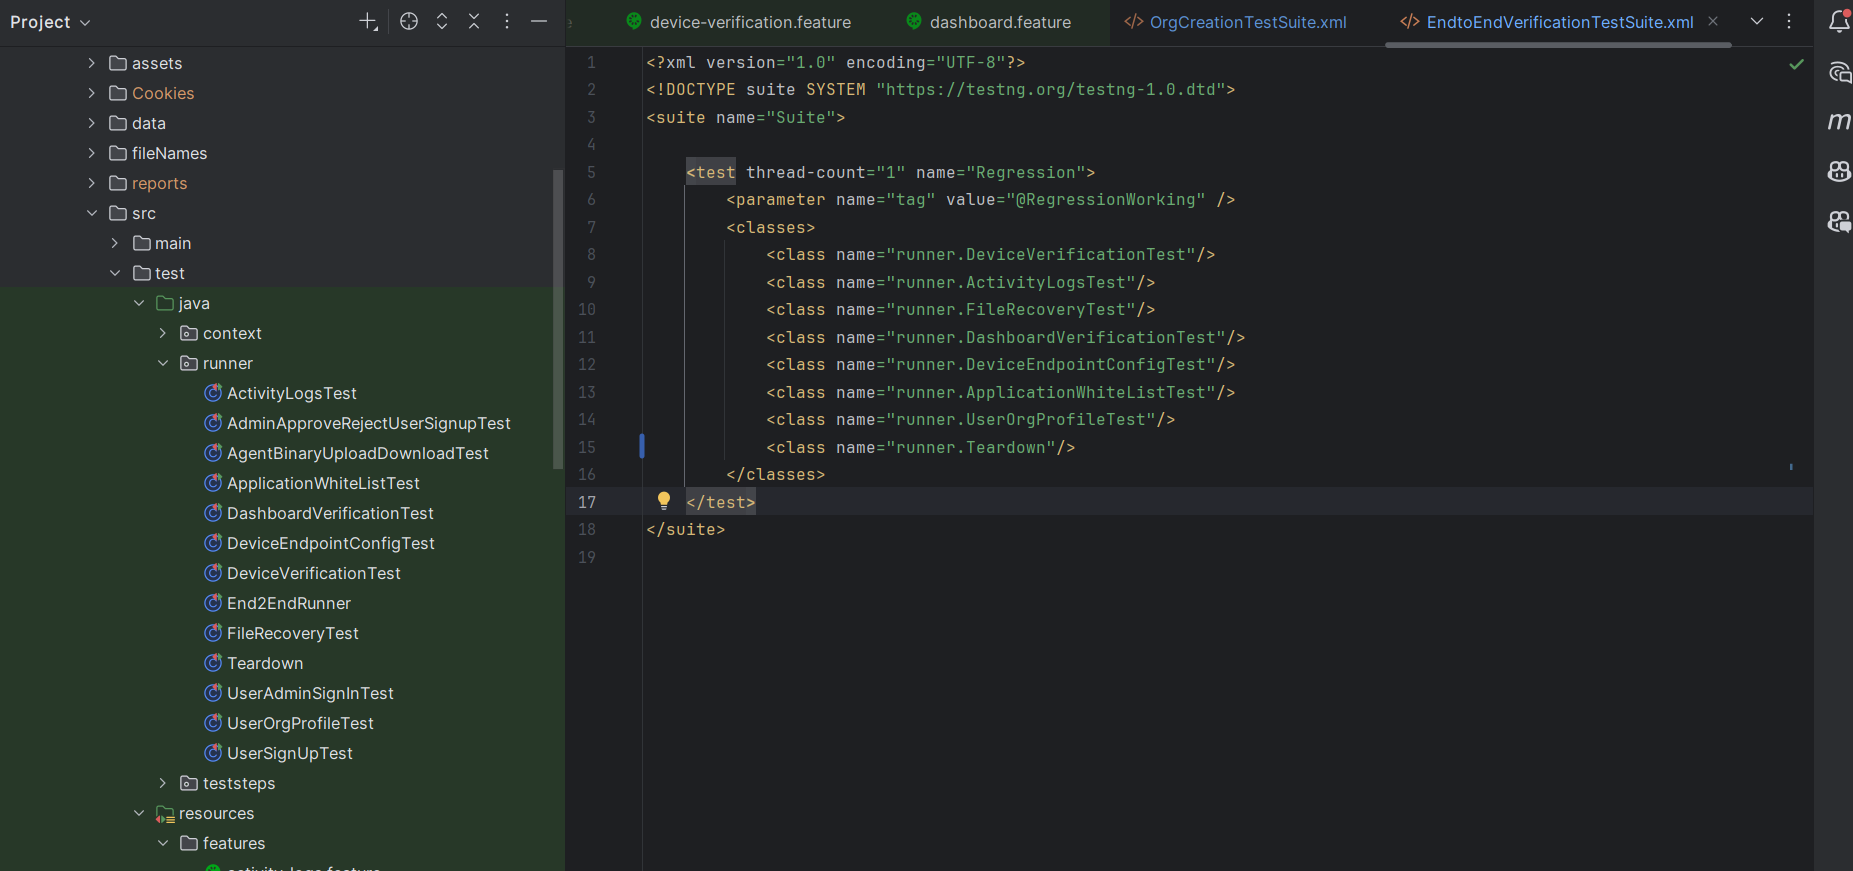
- Structured Test Suites: Including OrgCreationTestSuite.xml and EndtoEndDeviceVerificationTestSuite.xml
- Org ID Extraction The OrgCreationTest suite extracts the Org ID from Playwright logs using a regex pattern.
- Dynamic Integration The extracted Org ID is passed as an environment variable to Terraform and PowerShell scripts to configure the .exe agent.
- HTML Reports: Visual reports with logs and screenshots for every run
🔷3. VM Provisioning with Terraform
Terraform enables dynamic, repeatable VM provisioning for each environment.
What We Implemented:
- Dynamic Variable Files: Terraform selects environment-specific variable files (e.g., qa.tfvars, dev.tfvars) based on the selected configuration.
- Isolated State Management: Each env maintains its own Terraform state.
- Dynamic VM Naming: Prevents naming collisions with auto-generated, validated VM names.
- Integration with Azure: Terraform provisions Azure VMs based on workflow inputs.
☁️4. Azure CLI for VM Image Management
Using Azure CLI, we dynamically retrieve the latest Windows 10/11 images from the Azure Marketplace to provision test VMs.
Process Flow:
- Fetch OS Images: Retrieve latest Windows 10/11 images based on version and region.
- Process and Upload: Images are saved as JSON and consumed by Terraform for provisioning.
Sample Output:
 {
  "images": [
    {
      "publisher": "MicrosoftWindowsDesktop",
      "osType": "Windows 11",
      "displayName": "Windows 11 Pro ZH-CN, version 21H2",
      "version": "22000.1100.221015",
      "generation": "Gen 2",
      "offer": "windows-11",
      "marketplaceVersion": "21H2",
      "sku": "win11-21h2-pro-zh-cn",
      "edition": "Pro"
    },
    {
      "publisher": "MicrosoftWindowsDesktop",
      "osType": "Windows 11",
      "displayName": "Windows 11 Enterprise N, version 22H2",
      "version": "22621.5335.250509",
      "generation": "Gen 2",
      "offer": "windows-11",
      "marketplaceVersion": "22H2",
      "sku": "win11-22h2-entn",
      "edition": "Enterprise"
    },
🤖 5. Automating Agent Installation and Configuration
Once the VMs are ready, we automated the installation and setup of the DetectEndpoint.exe agent directly on the test VMs.
Steps in Brief:
- Agent Installation: The agent is downloaded and installed via PowerShell scripts during the Terraform apply phase.
- Configuration: Org ID and console base URL are injected via CI/CD pipeline variables.
- Validation: Logs from Playwright tests validate agent installation and ensure successful communication with the backend.
🖥️ 6. Integration Tests on Provisioned VMs
Once agents are live, we execute real integration tests that mimic ransomware scenarios.
Test Coverage Includes:
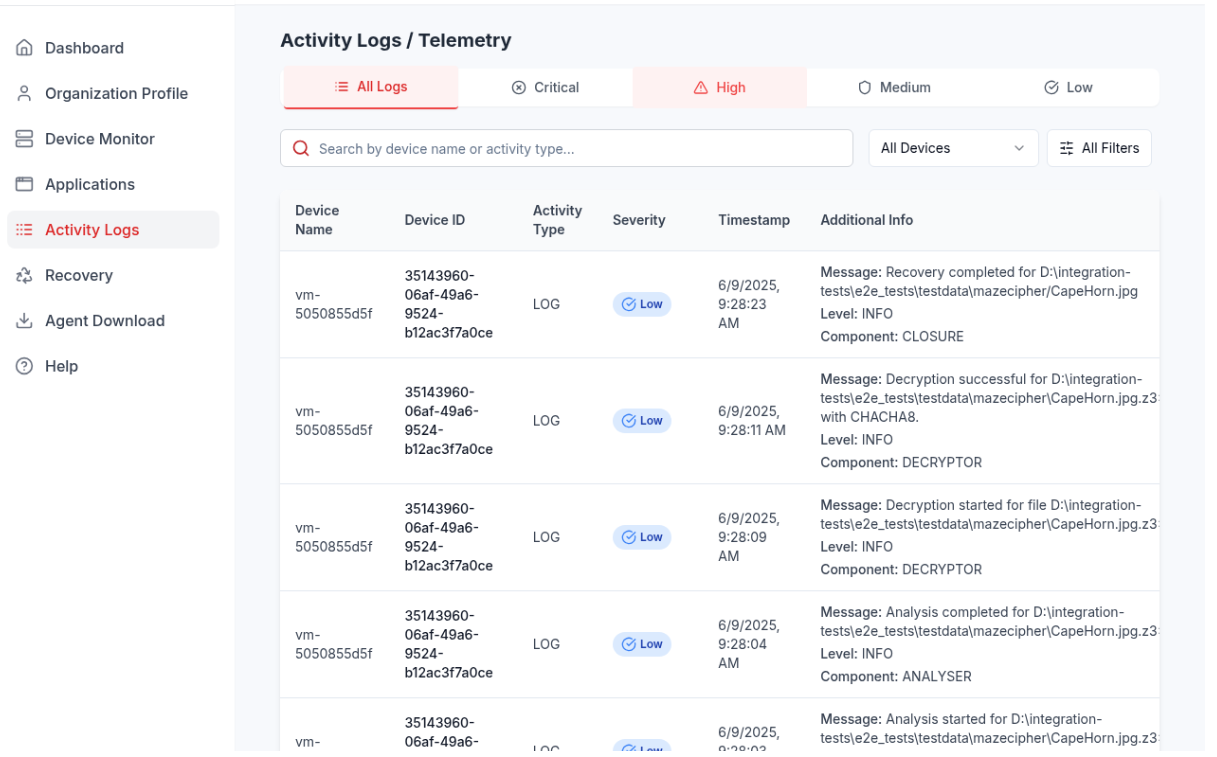
- Activity Logs: Ensure agents detect and log encryption/decryption events.
- Recovery Scenarios: Simulate ransomware events and validate file recovery mechanisms.
📊7. Comprehensive Reporting and Debugging
We prioritized transparency and debugging by:
📝 What We Capture:
- Artifacts: Upload all logs, reports, and Terraform plans post-run.
- Step-by-Step Logging: Every job outputs detailed logs.
- Validation Layers: Built-in checks ensure the whole pipeline runs reliably.

🏆 Outcomes and Wins
✅ Automation: End-to-end automation reduced manual effort drastically.
✅ Reliability: Isolated environments and dynamic validation made tests repeatable and trustworthy.
✅ Flexibility: Configurable inputs let us run tests across any scenario.
✅ Transparency: Every run generates traceable logs and HTML reports.
💡Final Thoughts
At AppNetWise, quality isn't just a goal — it's a guarantee.
By combining Infrastructure-as-Code, CI/CD pipelines, and real browser-based automation, we’ve built a testing framework that ensures that for a ransomware defense platform performs reliably — before a threat ever strikes.
🔜 What’s Next?
As we continue to evolve our E2E testing strategy, we’re extending our framework to include real-time system performance monitoring for our test environments.
🎯 Goals:
- Monitor Azure VM performance (CPU, memory, disk, network) during integration and ransomware simulation tests.
- Collect and correlate system metrics with CI/CD test events for deeper analysis.
- Enable proactive debugging and system health monitoring via interactive dashboards.
🛠️ Tools We’re Integrating:
- Telegraf – Collect system and application metrics from Azure VMs.
- InfluxDB – A high-performance time-series database to store telemetry data.
- Grafana – Create real-time, interactive dashboards for system observability.
- Exporters (e.g., Windows Exporter) – Expose VM metrics in a Prometheus-compatible format, paving the way for future alerting and extended monitoring.
This observability layer will help us go beyond just functional testing — giving us real-time insights into the behavior and stability of the platform under test.
💬 Collaboration Spotlight
My colleague Vijaya Kumari has been developing a robust performance testing framework for the same platform. Her solution integrates k6 for backend API load testing and Playwright for frontend performance metrics — all within a Docker-based setup enhanced by Grafana and InfluxDB dashboards.
👉 Check out her post here for more details.
🔔 Stay tuned for more insights into our testing strategies and the lessons we’re learning as we scale!
.png)


